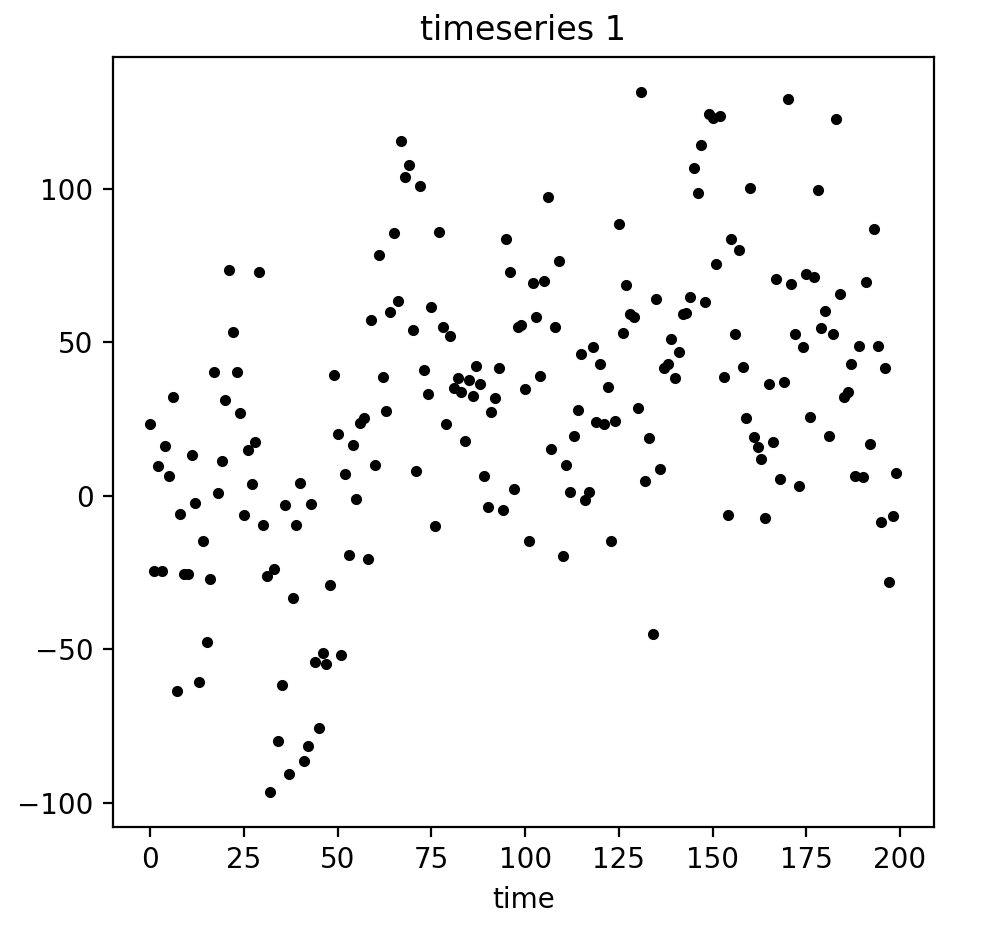
在处理数据的时候,我们经常会遇到一些非连续的散点时间序列数据:

有些时候,这样的散点数据是不利于我们进行数据的聚类和预测的。因此我们需要把它们平滑化,如下图所示:

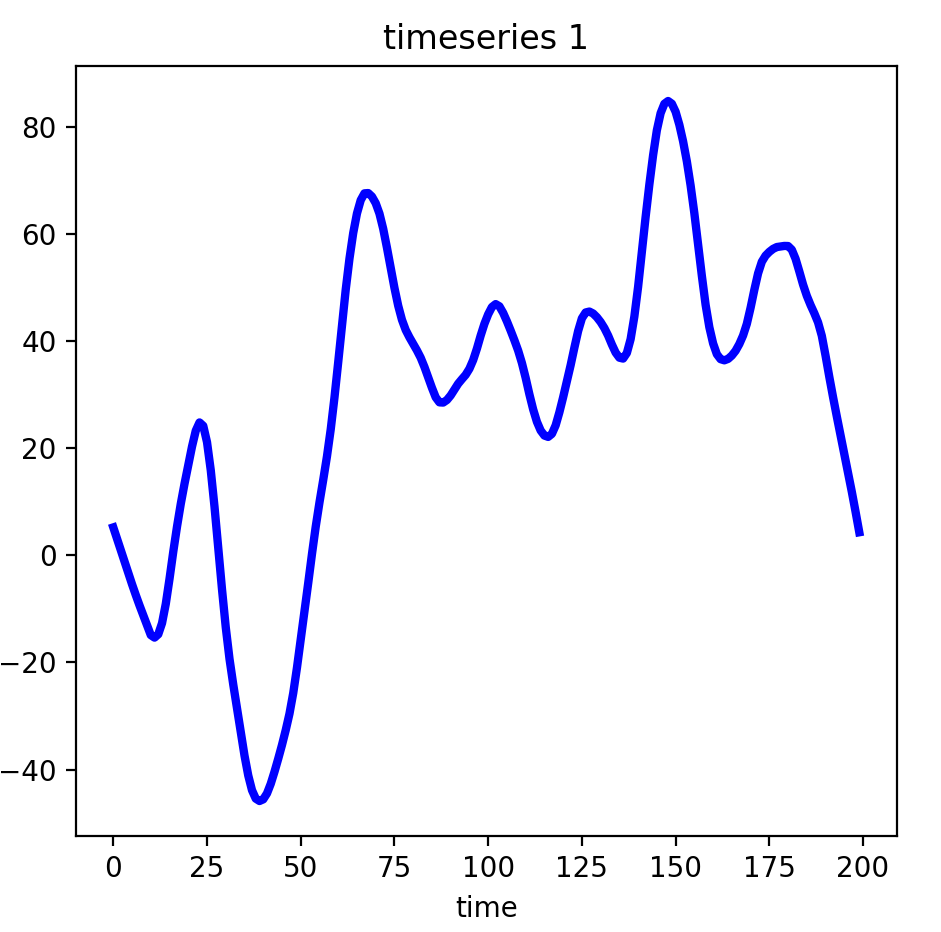
将散点都去除,平滑后的效果如下:

这样的时序数据是不是看起来舒服多了?此外,使用平滑后的时序数据去做聚类或预测或许有令人惊艳的效果,因为它去除了一些偏差值并细化了数据的分布范围。
如果我们自己开发一个这样的平滑工具,会耗费不少的时间。因为平滑的技术有很多种,你需要一个个地去研究,找到最合适的技术并编写代码,这是一个非常耗时的过程。平滑技术包括但不限于:
- 指数平滑
- 具有各种窗口类型(常数、汉宁、汉明、巴特利特、布莱克曼)的卷积平滑
- 傅立叶变换的频谱平滑
- 多项式平滑
- 各种样条平滑(线性、三次、自然三次)
- 高斯平滑
- 二进制平滑
所幸,有大佬已经为我们实现好了时间序列的这些平滑技术,并在GitHub上开源了这份模块的代码——它就是 tsmoothie。
下面就让我们来试一下 tsmoothie.
1.准备
开始之前,你要确保Python和pip已经成功安装在电脑上,如果没有,请访问这篇文章:超详细Python安装指南 进行安装。
(可选1) 如果你用Python的目的是数据分析,可以直接安装Anaconda:Python数据分析与挖掘好帮手—Anaconda,它内置了Python和pip.
(可选2) 此外,推荐大家用VSCode编辑器来编写小型Python项目:Python 编程的最好搭档—VSCode 详细指南
Windows环境下打开Cmd(开始—运行—CMD),苹果系统环境下请打开Terminal(command+空格输入Terminal),输入命令安装依赖:
pip install tsmoothie
PS, Tsmoothie仅支持Python 3.6 及以上的版本。
2.Tsmoothie 基本使用
为了尝试Tsmoothie的效果,我们需要生成随机数据:
import numpy as np
import matplotlib.pyplot as plt
from tsmoothie.utils_func import sim_randomwalk
from tsmoothie.smoother import LowessSmoother

# 生成 3 个长度为200的随机数据组
np.random.seed(123)
data = sim_randomwalk(n_series=3, timesteps=200,
                      process_noise=10, measure_noise=30)
然后使用Tsmoothie执行平滑化:
# 平滑
smoother = LowessSmoother(smooth_fraction=0.1, iterations=1)
smoother.smooth(data)
通过 smoother.smooth_data 你就可以获取平滑后的数据:
print(smoother.smooth_data)
# [[   5.21462928    3.07898076    0.93933646   -1.19847767   -3.32294934
#     -5.40678762   -7.42425709   -9.36150892  -11.23591897  -13.05271523
#      .......       .......       .......      .......       .......   ]]
绘制效果图:
# 生成范围区间
low, up = smoother.get_intervals('prediction_interval')

plt.figure(figsize=(18,5))

for i in range(3):

    plt.subplot(1,3,i+1)
    plt.plot(smoother.smooth_data[i], linewidth=3, color='blue')
    plt.plot(smoother.data[i], '.k')
    plt.title(f"timeseries {i+1}"); plt.xlabel('time')

    plt.fill_between(range(len(smoother.data[i])), low[i], up[i], alpha=0.3)
3.基于Tsmoothie的极端异常值检测
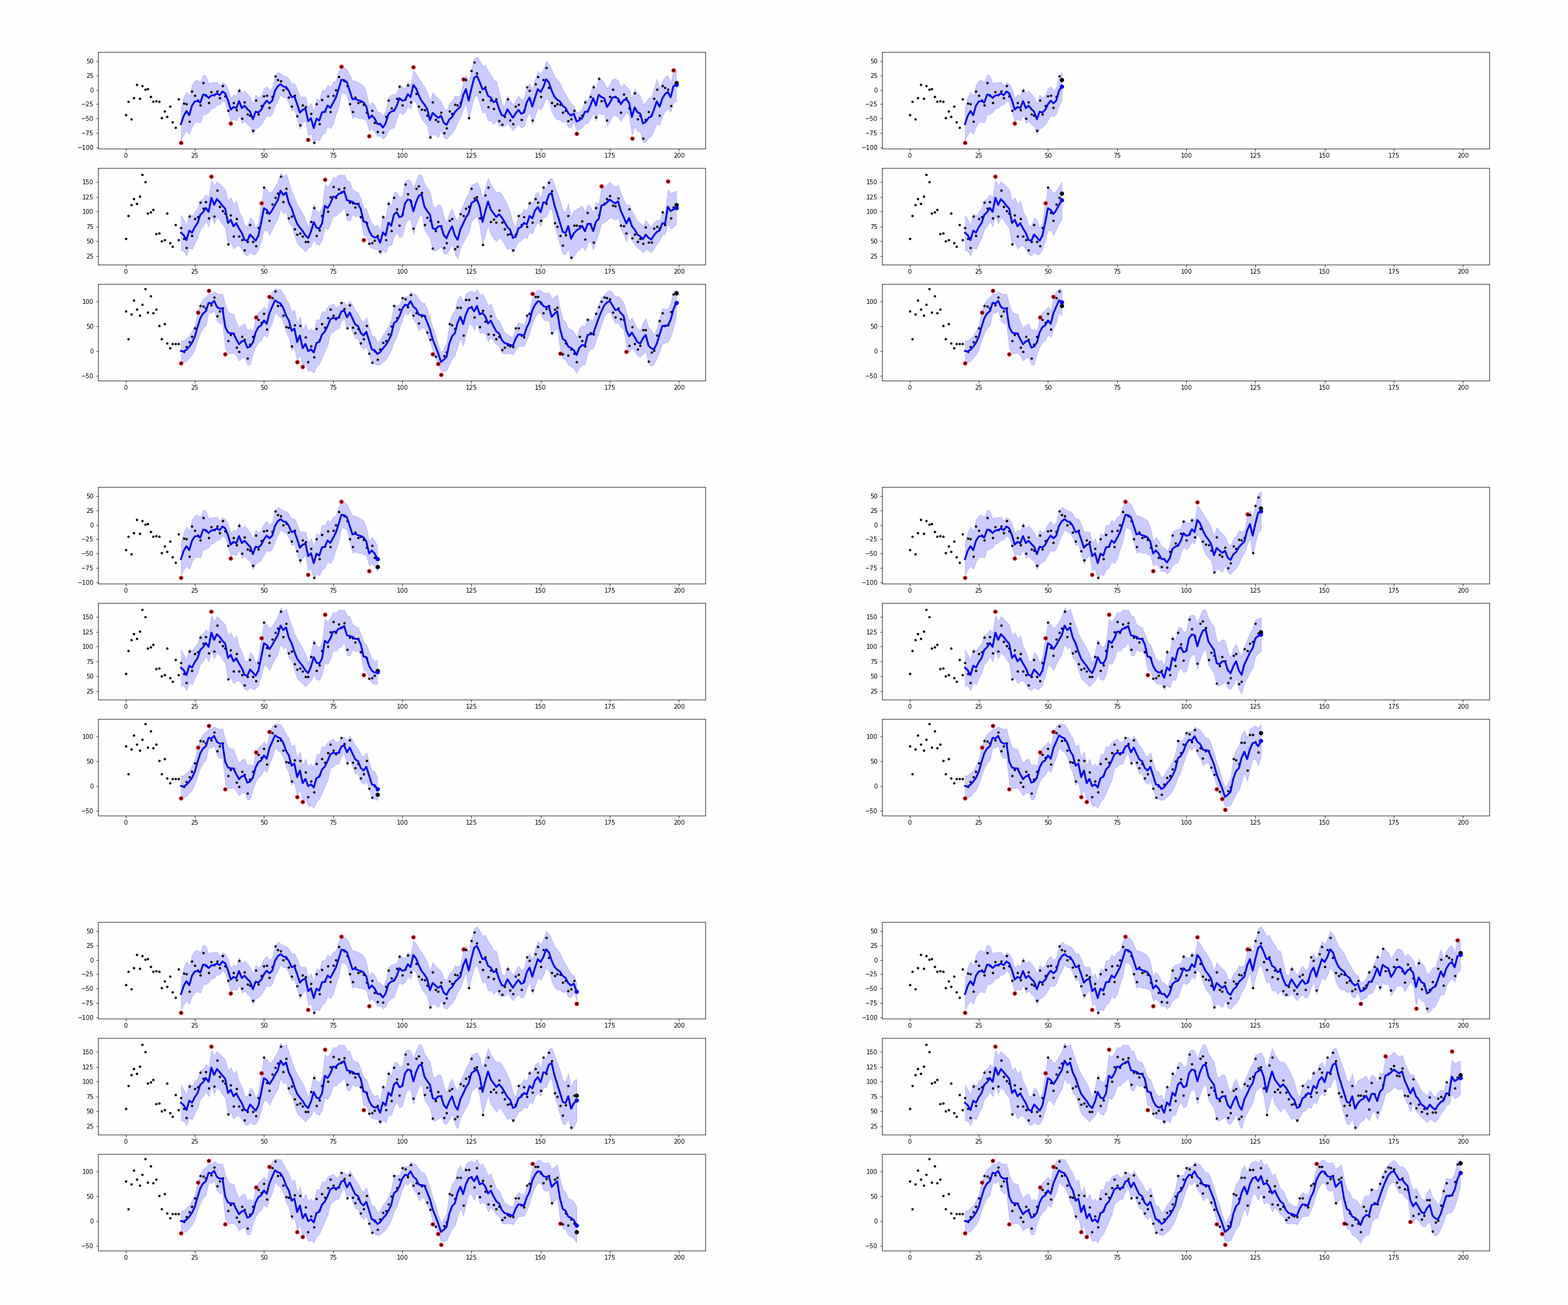
事实上,基于smoother生成的范围区域,我们可以进行异常值的检测:

可以看到,在蓝色范围以外的点,都属于异常值。我们可以轻易地将这些异常值标红或记录,以便后续的处理。
_low, _up = smoother.get_intervals('sigma_interval', n_sigma=2)
series['low'] = np.hstack([series['low'], _low[:,[-1]]])
series['up'] = np.hstack([series['up'], _up[:,[-1]]])
is_anomaly = np.logical_or(
    series['original'][:,-1] > series['up'][:,-1],
    series['original'][:,-1] < series['low'][:,-1]
).reshape(-1,1)
假设蓝色范围interval的最大值为up、最小值为low,如果存在 data > up 或 data < low 则表明此数据是异常点。
使用以下代码通过滚动数据点进行平滑化和异常检测,就能保存得到上方的GIF动图。
# https://github.com/cerlymarco/MEDIUM_NoteBook/blob/master/Anomaly_Detection_RealTime/Anomaly_Detection_RealTime.ipynb

import numpy as np
import matplotlib.pyplot as plt
from celluloid import Camera
from collections import defaultdict
from functools import partial
from tqdm import tqdm

from tsmoothie.utils_func import sim_randomwalk, sim_seasonal_data
from tsmoothie.smoother import *


def plot_history(ax, i, is_anomaly, window_len, color='blue', **pltargs):

    posrange = np.arange(0,i)

    ax.fill_between(posrange[window_len:],
                    pltargs['low'][1:], pltargs['up'][1:],
                    color=color, alpha=0.2)
    if is_anomaly:
        ax.scatter(i-1, pltargs['original'][-1], c='red')
    else:
        ax.scatter(i-1, pltargs['original'][-1], c='black')
    ax.scatter(i-1, pltargs['smooth'][-1], c=color)

    ax.plot(posrange, pltargs['original'][1:], '.k')
    ax.plot(posrange[window_len:],
            pltargs['smooth'][1:], color=color, linewidth=3)

    if 'ano_id' in pltargs.keys():
        if pltargs['ano_id'].sum()>0:
            not_zeros = pltargs['ano_id'][pltargs['ano_id']!=0] -1
            ax.scatter(not_zeros, pltargs['original'][1:][not_zeros],
                       c='red', alpha=1.)

np.random.seed(42)

n_series, timesteps = 3, 200

data = sim_randomwalk(n_series=n_series, timesteps=timesteps,
                      process_noise=10, measure_noise=30)

window_len = 20

fig = plt.figure(figsize=(18,10))
camera = Camera(fig)

axes = [plt.subplot(n_series,1,ax+1) for ax in range(n_series)]
series = defaultdict(partial(np.ndarray, shape=(n_series,1), dtype='float32'))

for i in tqdm(range(timesteps+1), total=(timesteps+1)):

    if i>window_len:

        smoother = ConvolutionSmoother(window_len=window_len, window_type='ones')
        smoother.smooth(series['original'][:,-window_len:])

        series['smooth'] = np.hstack([series['smooth'], smoother.smooth_data[:,[-1]]])

        _low, _up = smoother.get_intervals('sigma_interval', n_sigma=2)
        series['low'] = np.hstack([series['low'], _low[:,[-1]]])
        series['up'] = np.hstack([series['up'], _up[:,[-1]]])

        is_anomaly = np.logical_or(
            series['original'][:,-1] > series['up'][:,-1],
            series['original'][:,-1] < series['low'][:,-1]
        ).reshape(-1,1)

        if is_anomaly.any():
            series['ano_id'] = np.hstack([series['ano_id'], is_anomaly*i]).astype(int)

        for s in range(n_series):
            pltargs = {k:v[s,:] for k,v in series.items()}
            plot_history(axes[s], i, is_anomaly[s], window_len,
                         **pltargs)

        camera.snap()

    if i>=timesteps:
        continue

    series['original'] = np.hstack([series['original'], data[:,[i]]])


print('CREATING GIF...')  # it may take a few seconds
camera._photos = [camera._photos[-1]] + camera._photos
animation = camera.animate()
animation.save('animation1.gif', codec="gif", writer='imagemagick')
plt.close(fig)
print('DONE')
注意,异常点并非都是负面作用,在不同的应用场景下,它们可能代表了不同的意义。
比如在股票中,它或许可以代表着震荡行情中某种趋势反转的信号。
或者在家庭用电量分析中,它可能代表着某个时刻的用电峰值,根据这个峰值我们可以此时此刻开启了什么样的电器。
所以异常点的作用需要根据不同应用场景进行不同的分析,才能找到它真正的价值。
总而言之,Tsmoothie 不仅可以使用多种平滑技术平滑化我们的时序数据,还可以根据平滑结果找出数据中的离群点,是我们做数据分析和研究的一个好帮手,非常有价值。
我们的文章到此就结束啦,如果你喜欢今天的 Python 教程,请持续关注Python实用宝典。
有任何问题,可以在公众号后台回复:加群,回答相应验证信息,进入互助群询问。
原创不易,希望你能在下面点个赞和在看支持我继续创作,谢谢!
Python实用宝典 ( pythondict.com )
不只是一个宝典
欢迎关注公众号:Python实用宝典


评论(0)