关于强化学习的基础知识,可以阅读我们以前发表的一篇基础文章:
使用强化学习预测股价,类似于心理学中的操作性条件反射原理,你需要在决策的时候采取合适的行动 (Action) 使奖励最大化。与监督学习预测未来的数值不同,强化学习根据输入的状态(如当日开盘价、收盘价等),输出系列动作(例如:买进、持有、卖出),并对好的动作结果不断进行奖励,对差的动作结果不断进行惩罚,使得最后的收益最大化,实现自动交易。
如果你从头开始编写一套强化学习的代码,时间成本和试错成本会比较高。而本文的主角 FinRL 框架,能够帮助你极大地减少学习成本、时间成本和试错成本。下面就介绍一下 FinRL 的使用方法。
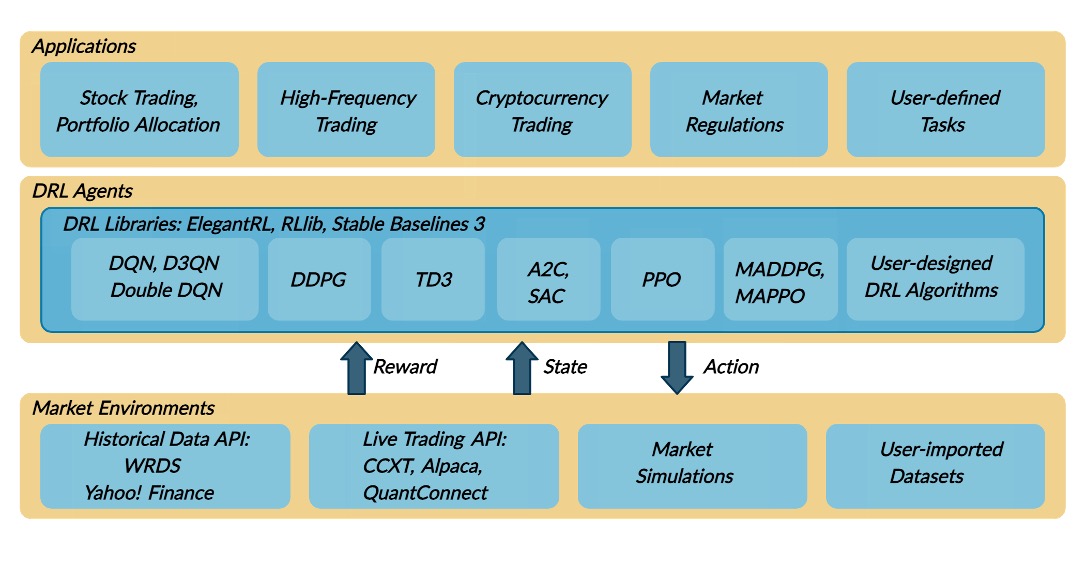
1.准备
开始之前,你要确保Python和pip已经成功安装在电脑上,如果没有,请访问这篇文章:超详细Python安装指南 进行安装。
(可选1) 如果你用Python的目的是数据分析,可以直接安装Anaconda:Python数据分析与挖掘好帮手—Anaconda,它内置了Python和pip.
(可选2) 此外,推荐大家用VSCode编辑器来编写小型Python项目:Python 编程的最好搭档—VSCode 详细指南
Windows环境下打开Cmd(开始—运行—CMD),苹果系统环境下请打开Terminal(command+空格输入Terminal),输入命令安装依赖:
# 首先克隆项目
git clone https://github.com/AI4Finance-Foundation/FinRL.git
# 进入刚克隆的项目,安装依赖
cd FinRL
pip install
请注意 Python 版本要大于等于 3.7。此外,如果你的当前Python环境下安装了 zipline,请 pip uninstall 掉 zipline,因为Zipline与FinRL不兼容。
可能出现的错误:
如果你出现以下红字提示:
error: command 'swig.exe' failed: No such file or directory
请使用conda安装swig:
conda install swig
然后重新执行 pip install . 即可。
2.模型训练
运行官方示例的时候会使用到雅虎财经的数据,雅虎财经在中国已经关闭服务,因此你会需要VPN才能下载雅虎财经的数据。
cd FinRL
python Stock_NeurIPS2018.py
运行的时候大概率会遇到这个问题(2022-07-03):
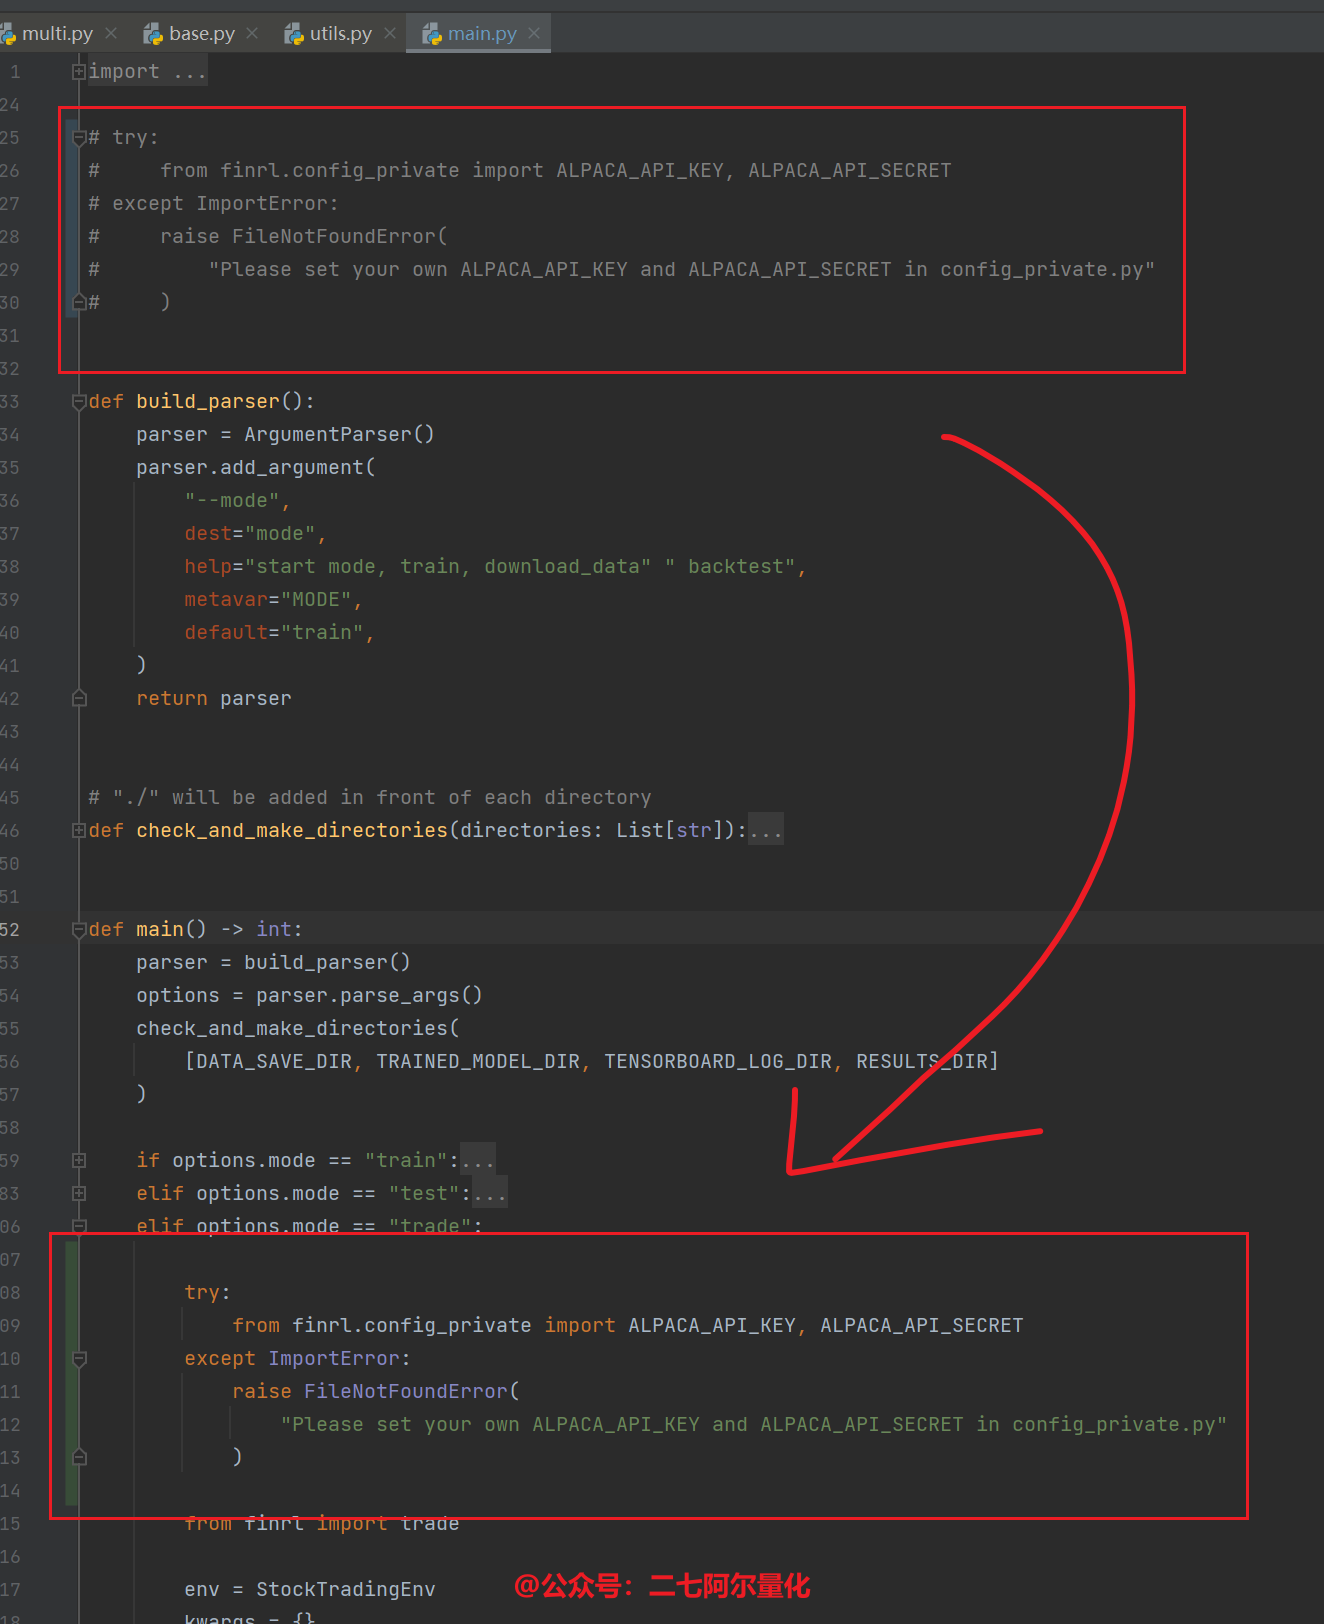
FileNotFoundError: Please set your own ALPACA_API_KEY and ALPACA_API_SECRET in config_private.py
这是官网的一个不严谨实现导致的,你可以将 finrl/main.py 中25~30行的代码移动到第100行,如下所示:
此外,在运行代码的时候,你可能会遇到无法下载数据的问题,这是因为雅虎财经在中国已经关闭服务,你需要在 Stock_NeurIPS2018.py 的第172行代码 fetch_data 函数中添加proxy参数:
# 公众号:二七阿尔量化
# 此处我的代理是10809端口,你应该按需修改
df = YahooDownloader(start_date = '2009-01-01',
                     end_date = '2021-10-31',
                     ticker_list = config_tickers.DOW_30_TICKER
                     ).fetch_data(proxy={"http": "http://127.0.0.1:10809", "https": "https://127.0.0.1:10809"})
此外,在 finrl/finrl_meta/preprocessor/preprocessors.py 的第191行,你也需要增加proxy参数:
# 公众号:二七阿尔量化
# 此处我的代理是10809端口,你应该按需修改
df_vix = YahooDownloader(
            start_date=df.date.min(), end_date=df.date.max(), ticker_list=["^VIX"]
        ).fetch_data(proxy={"http": "http://127.0.0.1:10809", "https": "https://127.0.0.1:10809"})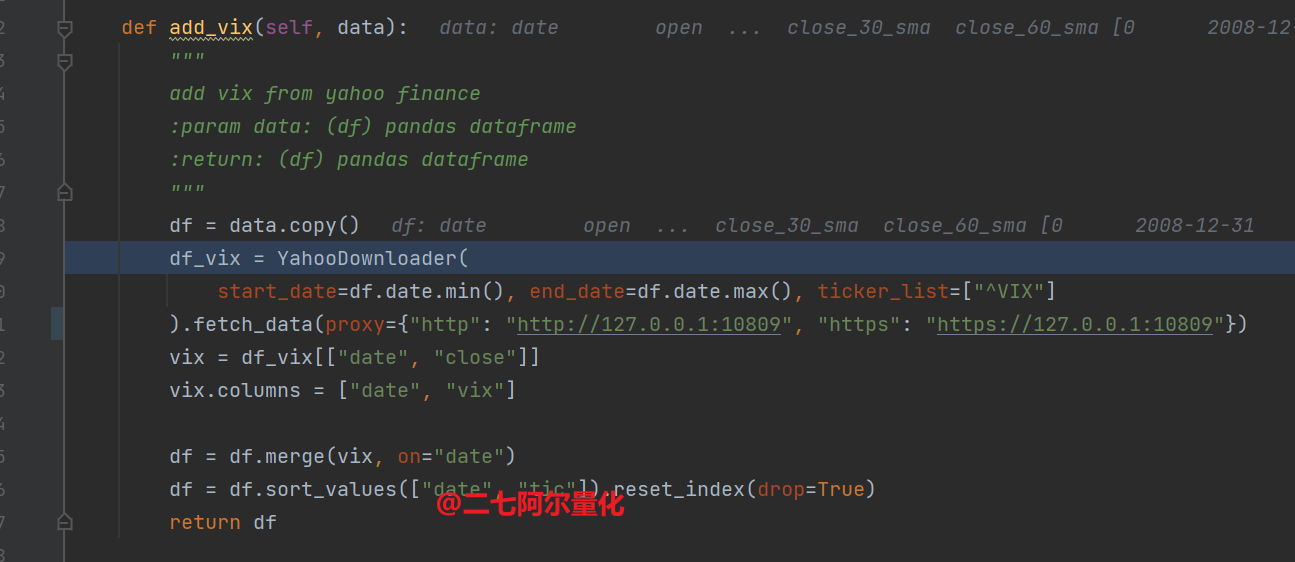
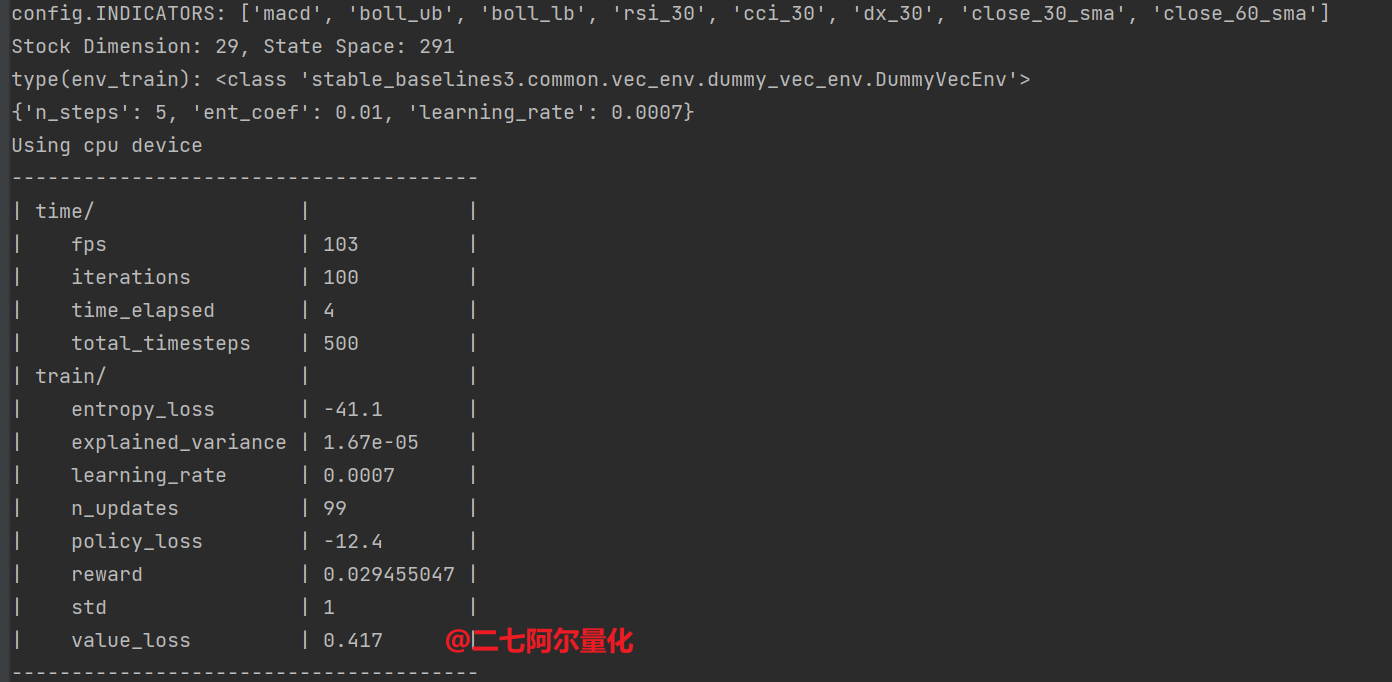
正常运行起来的模型训练如下图所示:
下面是我简化版的到SAC模型训练为止的全部代码:
# 公众号:二七阿尔量化
from finrl import config
from finrl import config_tickers
from finrl.main import check_and_make_directories

import pandas as pd

from finrl.finrl_meta.preprocessor.yahoodownloader import YahooDownloader
from finrl.finrl_meta.preprocessor.preprocessors import FeatureEngineer, data_split
from finrl.finrl_meta.env_stock_trading.env_stocktrading import StockTradingEnv
from finrl.agents.stablebaselines3.models import DRLAgent

import sys
sys.path.append("../FinRL-Library")

import itertools

from finrl.config import (
    DATA_SAVE_DIR,
    TRAINED_MODEL_DIR,
    TENSORBOARD_LOG_DIR,
    RESULTS_DIR,
)

check_and_make_directories([DATA_SAVE_DIR, TRAINED_MODEL_DIR, TENSORBOARD_LOG_DIR, RESULTS_DIR])


'''
# Part 1. 下载数据
'''

df = YahooDownloader(
    start_date='2009-01-01',
    end_date='2021-10-31',
    ticker_list=config_tickers.DOW_30_TICKER
).fetch_data(proxy={"http": "http://127.0.0.1:10809", "https": "https://127.0.0.1:10809"})


print(f"config_tickers.DOW_30_TICKER: {config_tickers.DOW_30_TICKER}")


print(f"df.shape: {df.shape}")


df.sort_values(['date','tic'],ignore_index=True).head()


'''
# Part 2: 数据预处理
'''

fe = FeatureEngineer(
                    use_technical_indicator=True,
                    tech_indicator_list=config.INDICATORS,
                    use_vix=True,
                    use_turbulence=True,
                    user_defined_feature = False)

processed = fe.preprocess_data(df)


list_ticker = processed["tic"].unique().tolist()
list_date = list(pd.date_range(processed['date'].min(),processed['date'].max()).astype(str))
combination = list(itertools.product(list_date,list_ticker))

processed_full = pd.DataFrame(combination,columns=["date","tic"]).merge(processed,on=["date","tic"],how="left")
processed_full = processed_full[processed_full['date'].isin(processed['date'])]
processed_full = processed_full.sort_values(['date','tic'])

processed_full = processed_full.fillna(0)


processed_full.sort_values(['date','tic'],ignore_index=True).head(10)

# 训练集
train = data_split(processed_full, '2009-01-01','2020-07-01')
# 测试集
trade = data_split(processed_full, '2020-07-01','2021-10-31')

print(f"len(train): {len(train)}")
print(f"len(trade): {len(trade)}")
print(f"train.tail(): {train.tail()}")
print(f"trade.head(): {trade.head()}")
print(f"config.INDICATORS: {config.INDICATORS}")
stock_dimension = len(train.tic.unique())
state_space = 1 + 2*stock_dimension + len(config.INDICATORS)*stock_dimension
print(f"Stock Dimension: {stock_dimension}, State Space: {state_space}")

buy_cost_list = sell_cost_list = [0.001] * stock_dimension
num_stock_shares = [0] * stock_dimension

env_kwargs = {
    "hmax": 100,
    "initial_amount": 1000000,
    "num_stock_shares": num_stock_shares,
    "buy_cost_pct": buy_cost_list,
    "sell_cost_pct": sell_cost_list,
    "state_space": state_space,
    "stock_dim": stock_dimension,
    "tech_indicator_list": config.INDICATORS,
    "action_space": stock_dimension,
    "reward_scaling": 1e-4
}


e_train_gym = StockTradingEnv(df = train, **env_kwargs)

env_train, _ = e_train_gym.get_sb_env()
print(f"type(env_train): {type(env_train)}")


'''
# Part 3: 模型训练
'''
agent = DRLAgent(env = env_train)
SAC_PARAMS = {
    "batch_size": 128,
    "buffer_size": 1000000,
    "learning_rate": 0.0001,
    "learning_starts": 100,
    "ent_coef": "auto_0.1",
}

model_sac = agent.get_model("sac", model_kwargs = SAC_PARAMS)


trained_sac = agent.train_model(model=model_sac,
                             tb_log_name='sac',
                             total_timesteps=60000)
3.模型测试
在这一部分,我们将使用测试集进行模拟交易,检验模型的效果。
在env_kwargs中,我们设置了初始资金为1000000美元,测试也会以这个初始资金为起点。
# 测试
e_trade_gym = StockTradingEnv(df=trade, turbulence_threshold=70, risk_indicator_col='vix', **env_kwargs)
df_account_value, df_actions = DRLAgent.DRL_prediction(
    model=trained_sac,
    environment=e_trade_gym
)
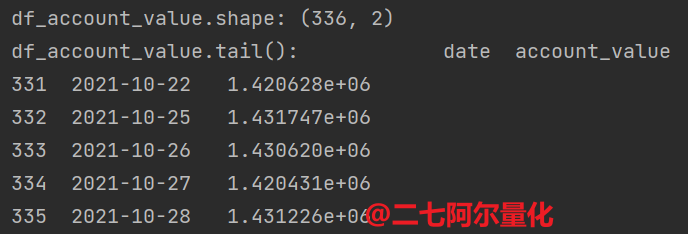
print(f"df_account_value.tail(): {df_account_value.tail()}")
如下:
此外,df_actions内保存了每天的持仓记录:
print(f"df_actions.head(): {df_actions.head()}")
调用 backtest_stats 函数,能获得完整的回测结果:
print("==============Get Backtest Results===========")
now = datetime.datetime.now().strftime('%Y%m%d-%Hh%M')

perf_stats_all = backtest_stats(account_value=df_account_value)
perf_stats_all = pd.DataFrame(perf_stats_all)
perf_stats_all.to_csv("./"+config.RESULTS_DIR+"/perf_stats_all_"+now+'.csv')
结果如下所示:

可以见到,模型的年化收益为30%,累计净值收益为43%.
但是这段时间为美股的牛市,我们还需要以道琼斯指数为基准计算超额收益,才能更直观地展示模型的效果:
print("==============Get Baseline Stats===========")
baseline_df = get_baseline(
        ticker="^DJI",
        start = df_account_value.loc[0,'date'],
        end = df_account_value.loc[len(df_account_value)-1,'date'])

stats = backtest_stats(baseline_df, value_col_name = 'close')

可见模型还是具有超额收益的,我们将其绘制为图表更清晰地表达:
backtest_result = backtest_plot(df_account_value,
             baseline_ticker = '^DJI',
             baseline_start = df_account_value.loc[0,'date'],
             baseline_end = df_account_value.loc[len(df_account_value)-1,'date'])
with open("backtest_result.html", "w") as file:
    file.write(backtest_result)
作者给我们内置了许多漂亮的回测图表,非常好用。但我们只需要看最关键的cumulative returns. 从图中可以看到这个模型(绿色的线条)一开始的表现并不如指数,但是到了后面,它的表现渐渐优于指数。
当然,这是官方给的示例数据,大家可以用自己的因子补充数据,将模型完善地更好。本文的示例中使用的是SAC模型,你也可以尝试其他的强化学习模型。
总之,Finrl 只能提供你一双”巨人的肩膀“,你应该根据自己的实际业务场景和数据类型使用不同的优化方法。
4.其他
FinRL不只能支持美股,它还支持A股的部分数据源,如聚宽、米筐和Tushare:
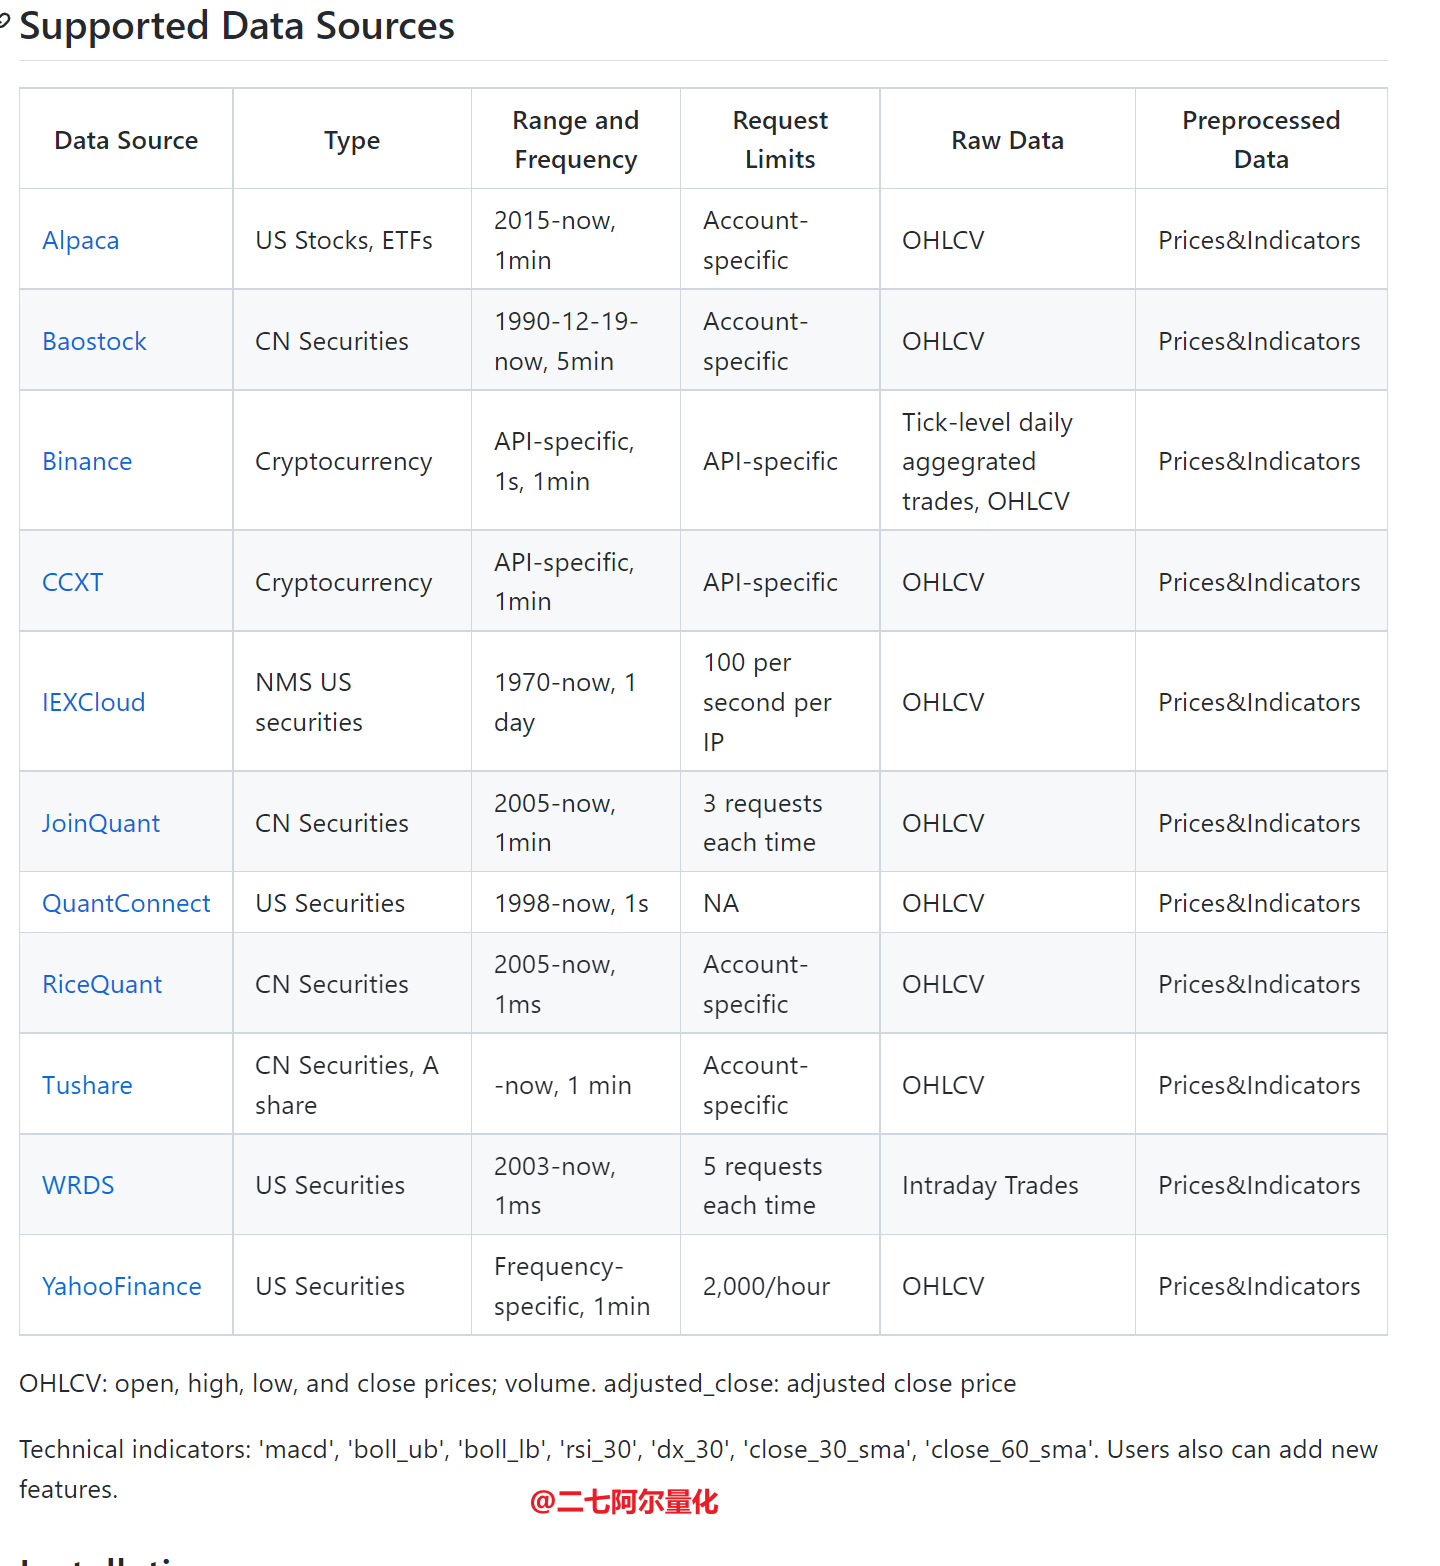
以downloader为例,用法很简单,库中提供了 Tushare 的 downloader, 你只需要把:
from finrl.finrl_meta.preprocessor.yahoodownloader import YahooDownloader
替换为:
from finrl.finrl_meta.preprocessor.tusharedownloader import TushareDownloader
并进行相应的代码修改即可,当然,除此之外还有许多细节问题需要处理,由于文章篇幅的问题,我们留到下篇文章再给大家介绍。
我们的文章到此就结束啦,如果你喜欢今天的 Python 教程,请持续关注Python实用宝典。
有任何问题,可以在公众号后台回复:加群,回答相应验证信息,进入互助群询问。
原创不易,希望你能在下面点个赞和在看支持我继续创作,谢谢!
Python实用宝典 ( pythondict.com )
不只是一个宝典
欢迎关注公众号:Python实用宝典


评论(0)