
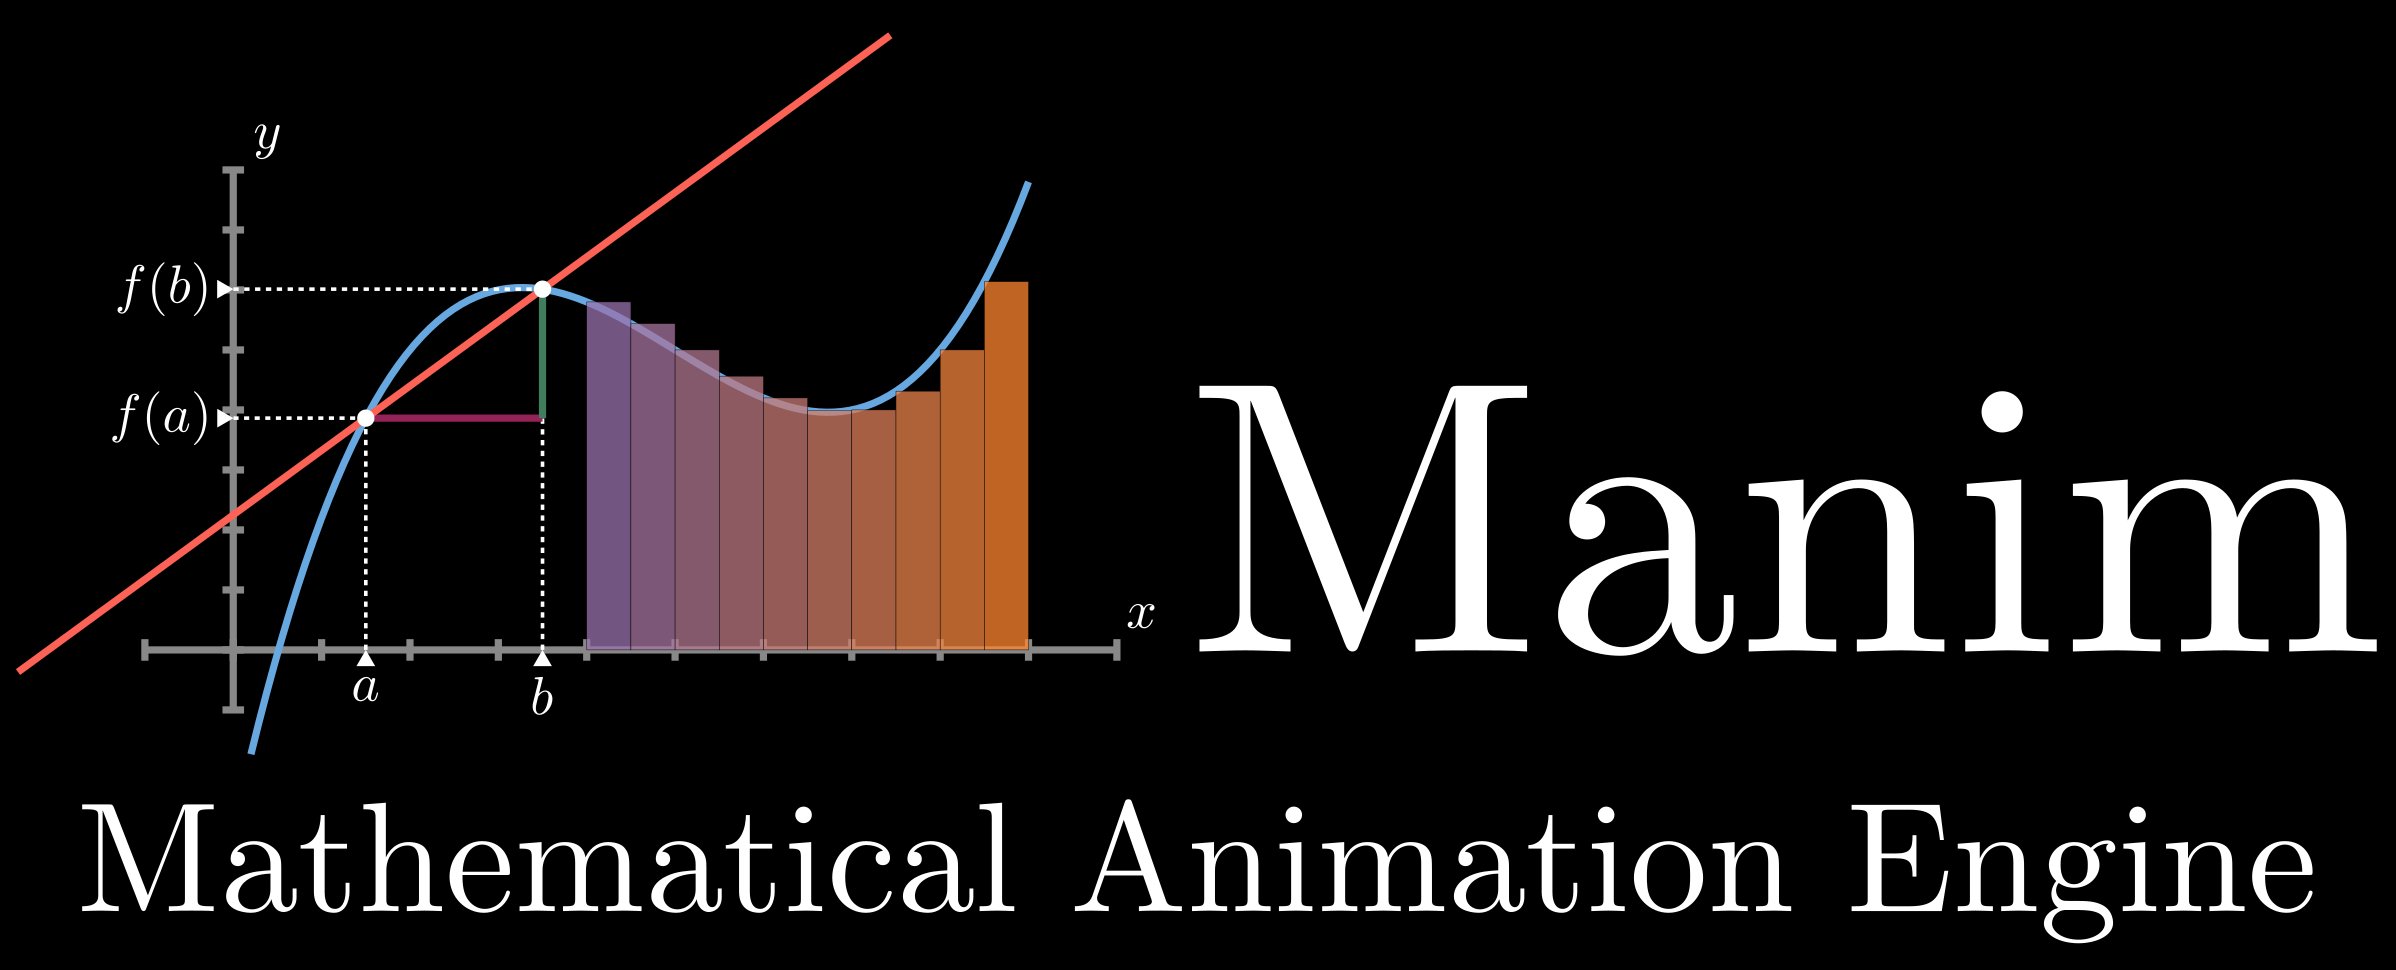
Manim 是3b1b开源的一个特别漂亮的数学动画模块。
我们能够基于Manim绘制许多解释性的动画,比如下面这个:
也支持函数图像:

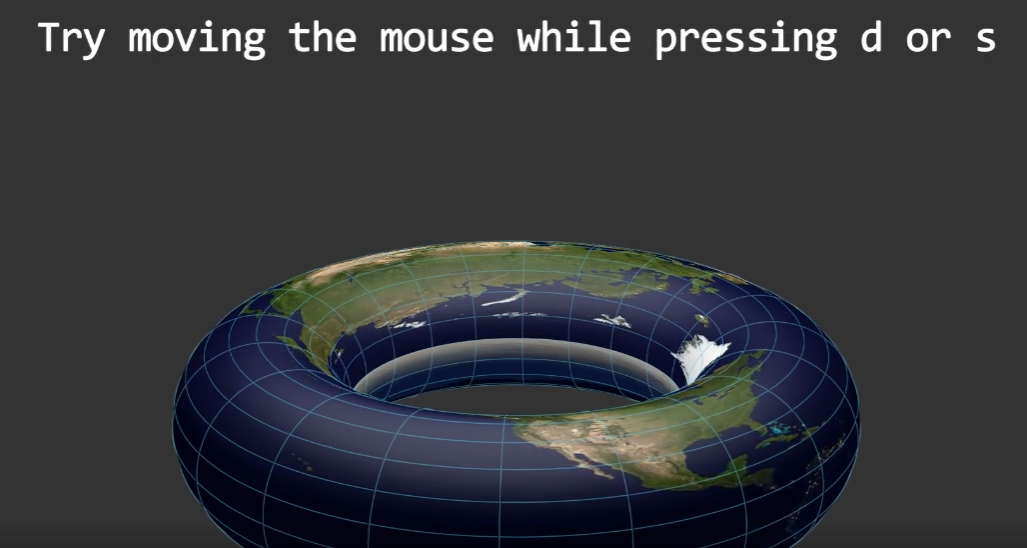
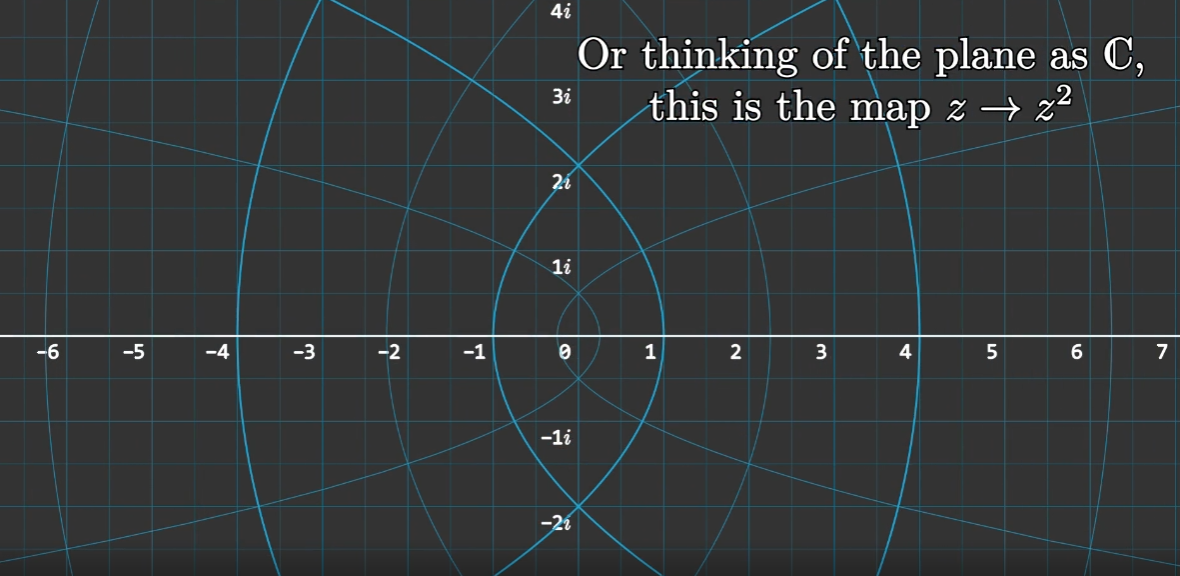
甚至是一些3D视图和矩阵变换,Manim都可以轻易实现:
如果你是一个数学课程的演讲者,或者你需要给观众演示某些数学公式的图形,那么Manim就是你的不二之选。
Manim 支持 Python 3.7 及以上版本,推荐Python3.8.
1.准备
开始之前,你要确保Python和pip已经成功安装在电脑上,如果没有,请访问这篇文章:超详细Python安装指南 进行安装。
(可选1) 如果你用Python的目的是数据分析,可以直接安装Anaconda:Python数据分析与挖掘好帮手—Anaconda,它内置了Python和pip.
(可选2) 此外,推荐大家用VSCode编辑器来编写小型Python项目:Python 编程的最好搭档—VSCode 详细指南
Windows环境下打开Cmd(开始—运行—CMD),苹果系统环境下请打开Terminal(command+空格输入Terminal),输入命令安装依赖:
conda create --name manim python=3.8 # 创建虚拟环境
conda activate manim # 切换到此虚拟环境
pip install manimgl # 安装manim
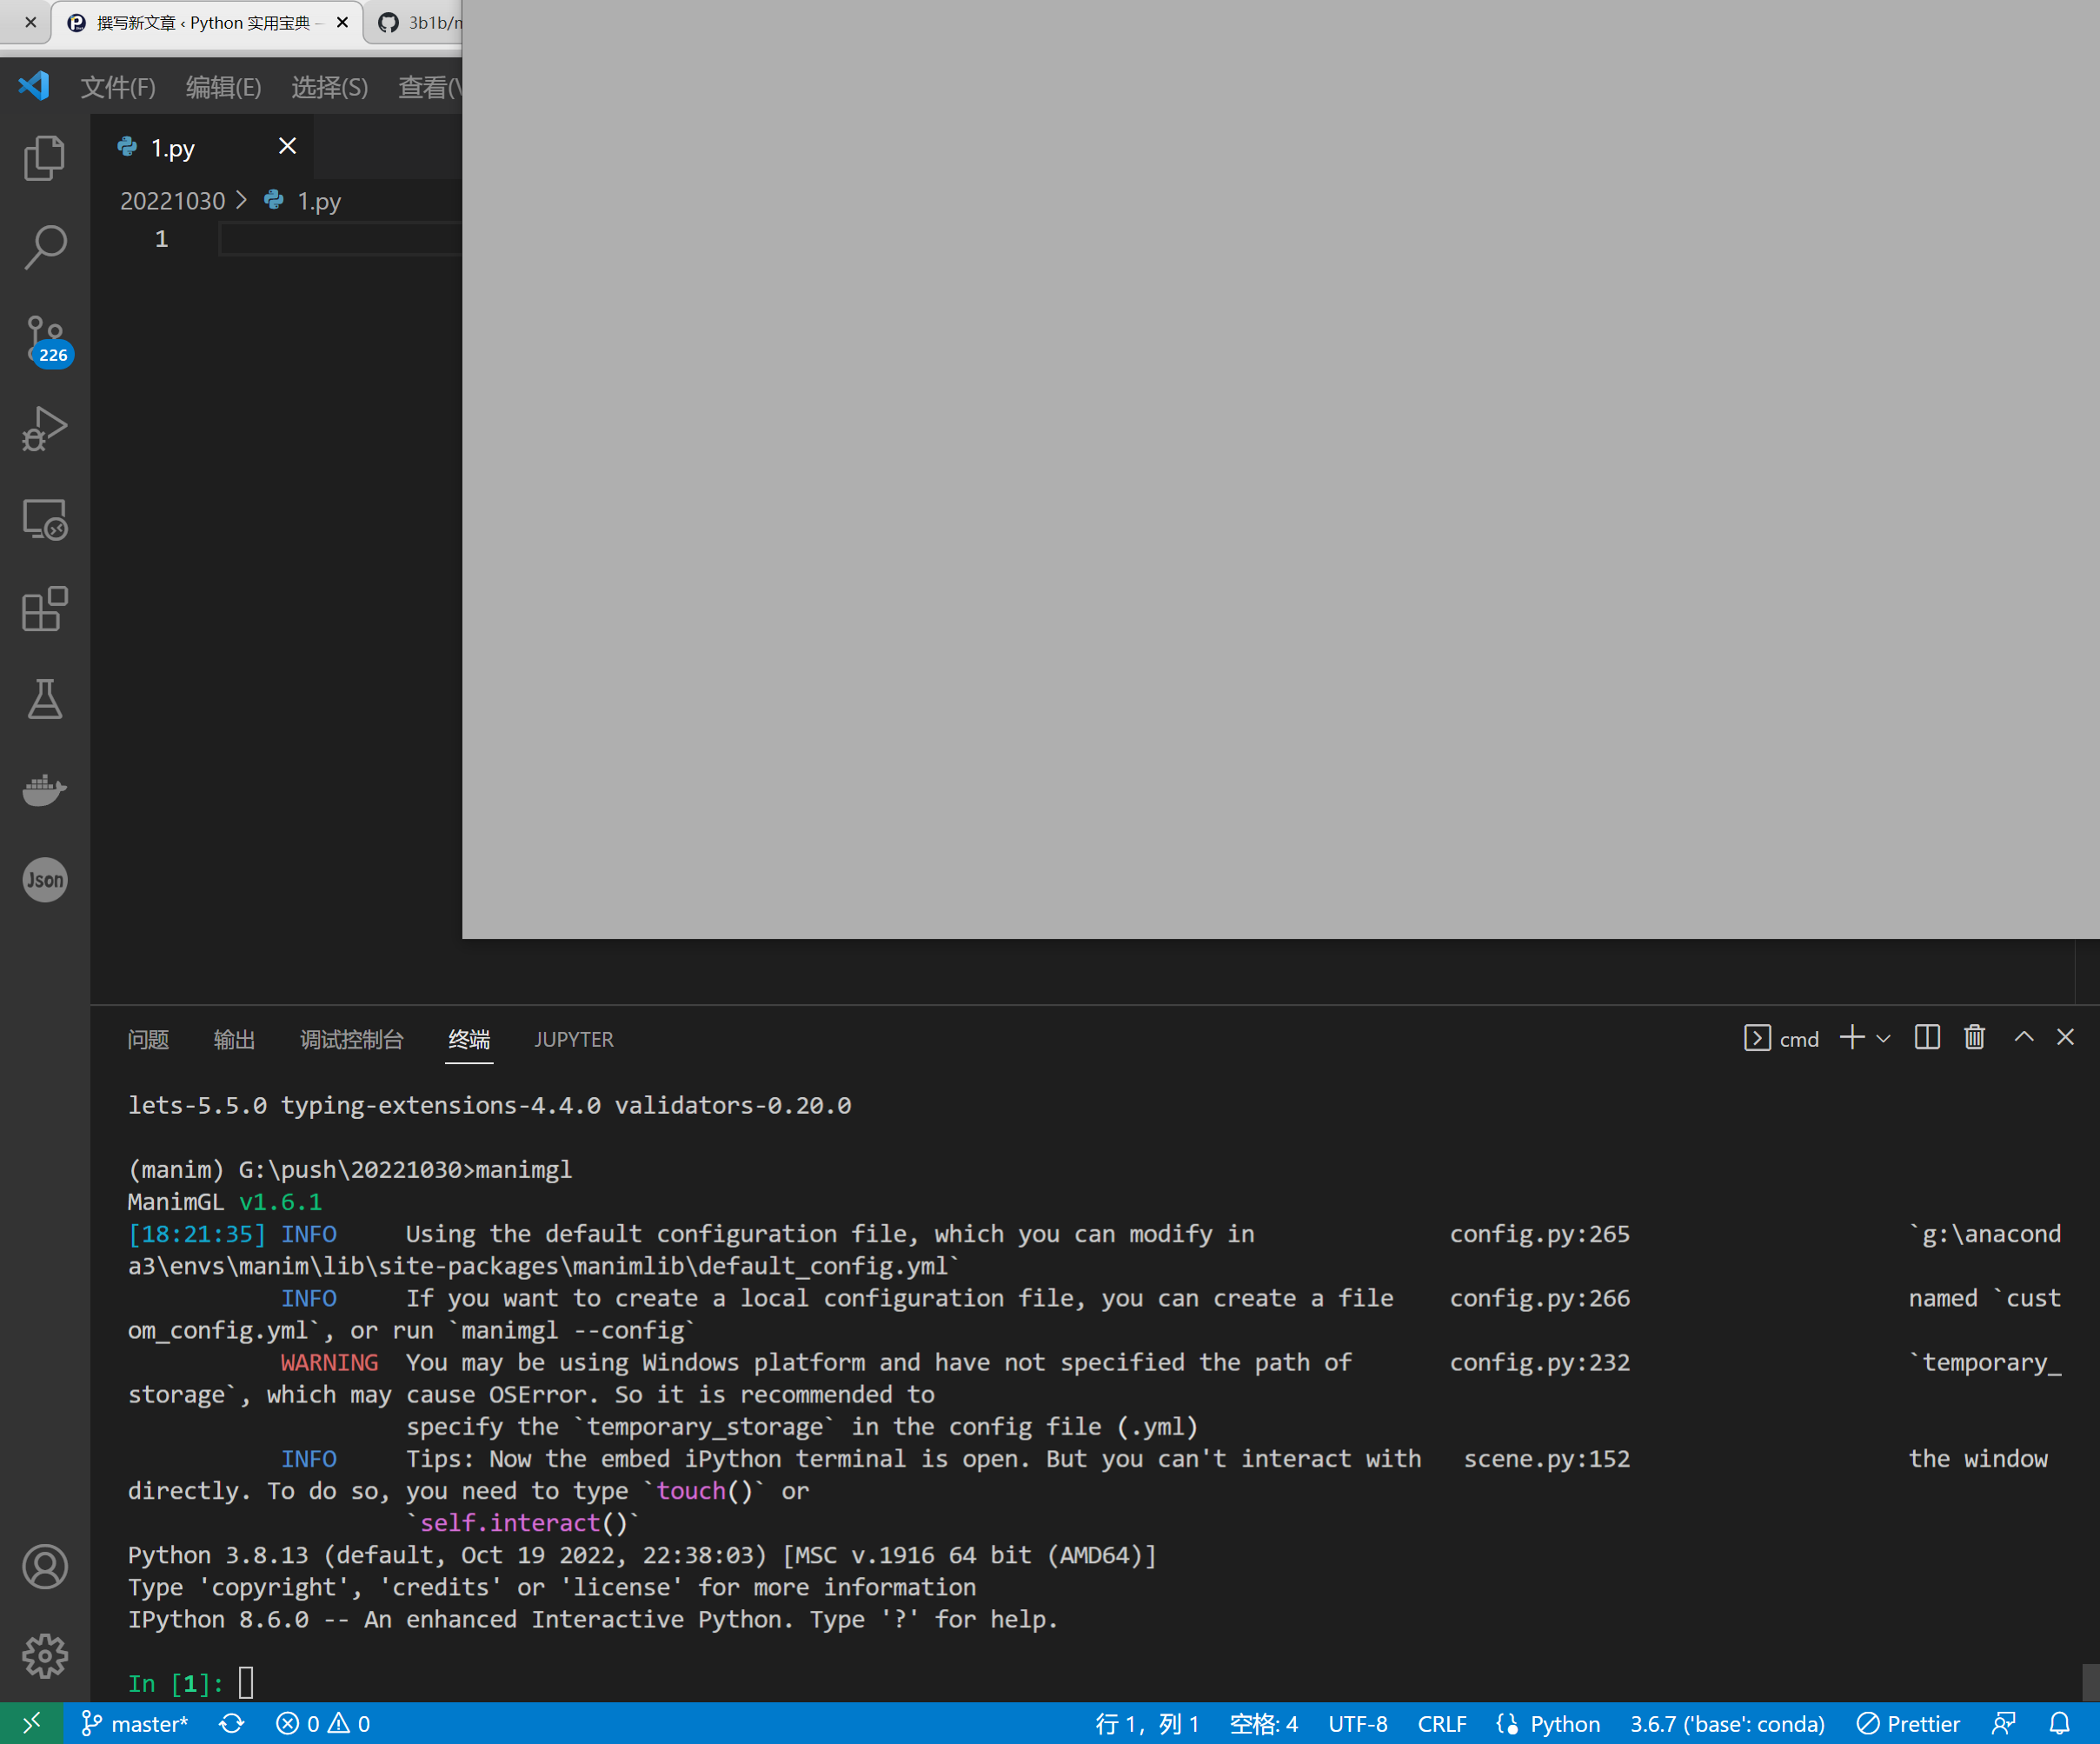
安装完毕后在终端输入 manimgl,会出现如下的界面,说明安装完成。
2. Manim 基本使用
首先学会画一个基本的数学图形,如圆圈:
from manimlib import *

class SquareToCircle(Scene):
    def construct(self):
        circle = Circle()
        circle.set_fill(BLUE, opacity=0.5)
        circle.set_stroke(BLUE_E, width=4)

        self.add(circle)
编写完毕后,在终端里敲下这行命令:
manimgl 你的py文件名.py SquareToCircle
就能弹出一个图形界面,绘制完成:

你还可以操作弹出的这个窗口:
- 滚动鼠标中键来上下移动画面
- 按住键盘上 z 键的同时滚动鼠标中键来缩放画面
- 按住键盘上 f 键的同时移动鼠标来平移画面
- 按住键盘上 d 键的同时移动鼠标来改变三维视角
- 按下键盘上 r 键恢复到最初的视角
最后,你可以通过按 q 来关闭窗口并退出程序。
接下来,我们学习如何让圆形变成方形:
# 公众号: Python实用宝典
from manimlib import *

class CircleToSquare(Scene):
    def construct(self):
        square = Square()
        square.set_fill(BLUE, opacity=0.5)
        square.set_stroke(BLUE_E, width=4)
        circle = Circle()

        self.play(ShowCreation(circle))
        self.wait()
        self.play(ReplacementTransform(circle, square))
        self.wait()
ShowCreation: 演示圆圈绘制过程。
ReplacementTransform: 延时从第一个参数的图形变化到第二个参数的图形的过程。
self.wait(): 等待上个play操作执行完成。
终端运行命令:
manimgl 你的py文件名.py CircleToSquare
效果如下:

再来一个复杂一点的演示,增加拉伸、旋转和变换:
# 公众号: Python实用宝典
from manimlib import *

class CircleToSquare(Scene):
    def construct(self):
        square = Square()
        square.set_fill(BLUE, opacity=0.5)
        square.set_stroke(BLUE_E, width=4)
        circle = Circle()

        self.play(ShowCreation(circle))
        self.wait()
        self.play(ReplacementTransform(circle, square))
        self.wait()
        # 在水平方向上拉伸到四倍
        self.play(square.animate.stretch(4, dim=0))
        self.wait()
        # 旋转90°
        self.play(Rotate(square, TAU / 4))
        self.wait()
        # 在向右移动2单位同时缩小为原来的1/4
        self.play(square.animate.shift(2 * RIGHT), square.animate.scale(0.25))
        self.wait()
        # 为了非线性变换,给square增加10段曲线(不会播放动画)
        square.insert_n_curves(10)
        # 给square上的所有点施加f(z)=z^2的复变换
        self.play(square.animate.apply_complex_function(lambda z: z**2))
        self.wait()
square.animate.stretch: 将图形拉伸第一个参数的倍数,第二个维度指明方向,dim=0为水平方向,dim=1为垂直方向。
square.animate.shift: 可以调整图形位置和大小。
square.animate.apply_complex_function: 增加函数复变换。
效果如下:

3. Manim 坐标轴与函数图像
想要实现函数图像绘制,我们需要先添加坐标轴:
# 公众号: Python实用宝典
from manimlib import *

class GraphExample(Scene):
    def construct(self):
        axes = Axes((-3, 10), (-1, 8))
        axes.add_coordinate_labels()

        self.play(Write(axes, lag_ratio=0.01, run_time=1))
运行以下命令显示坐标轴:
manimgl 你的py文件名.py GraphExample
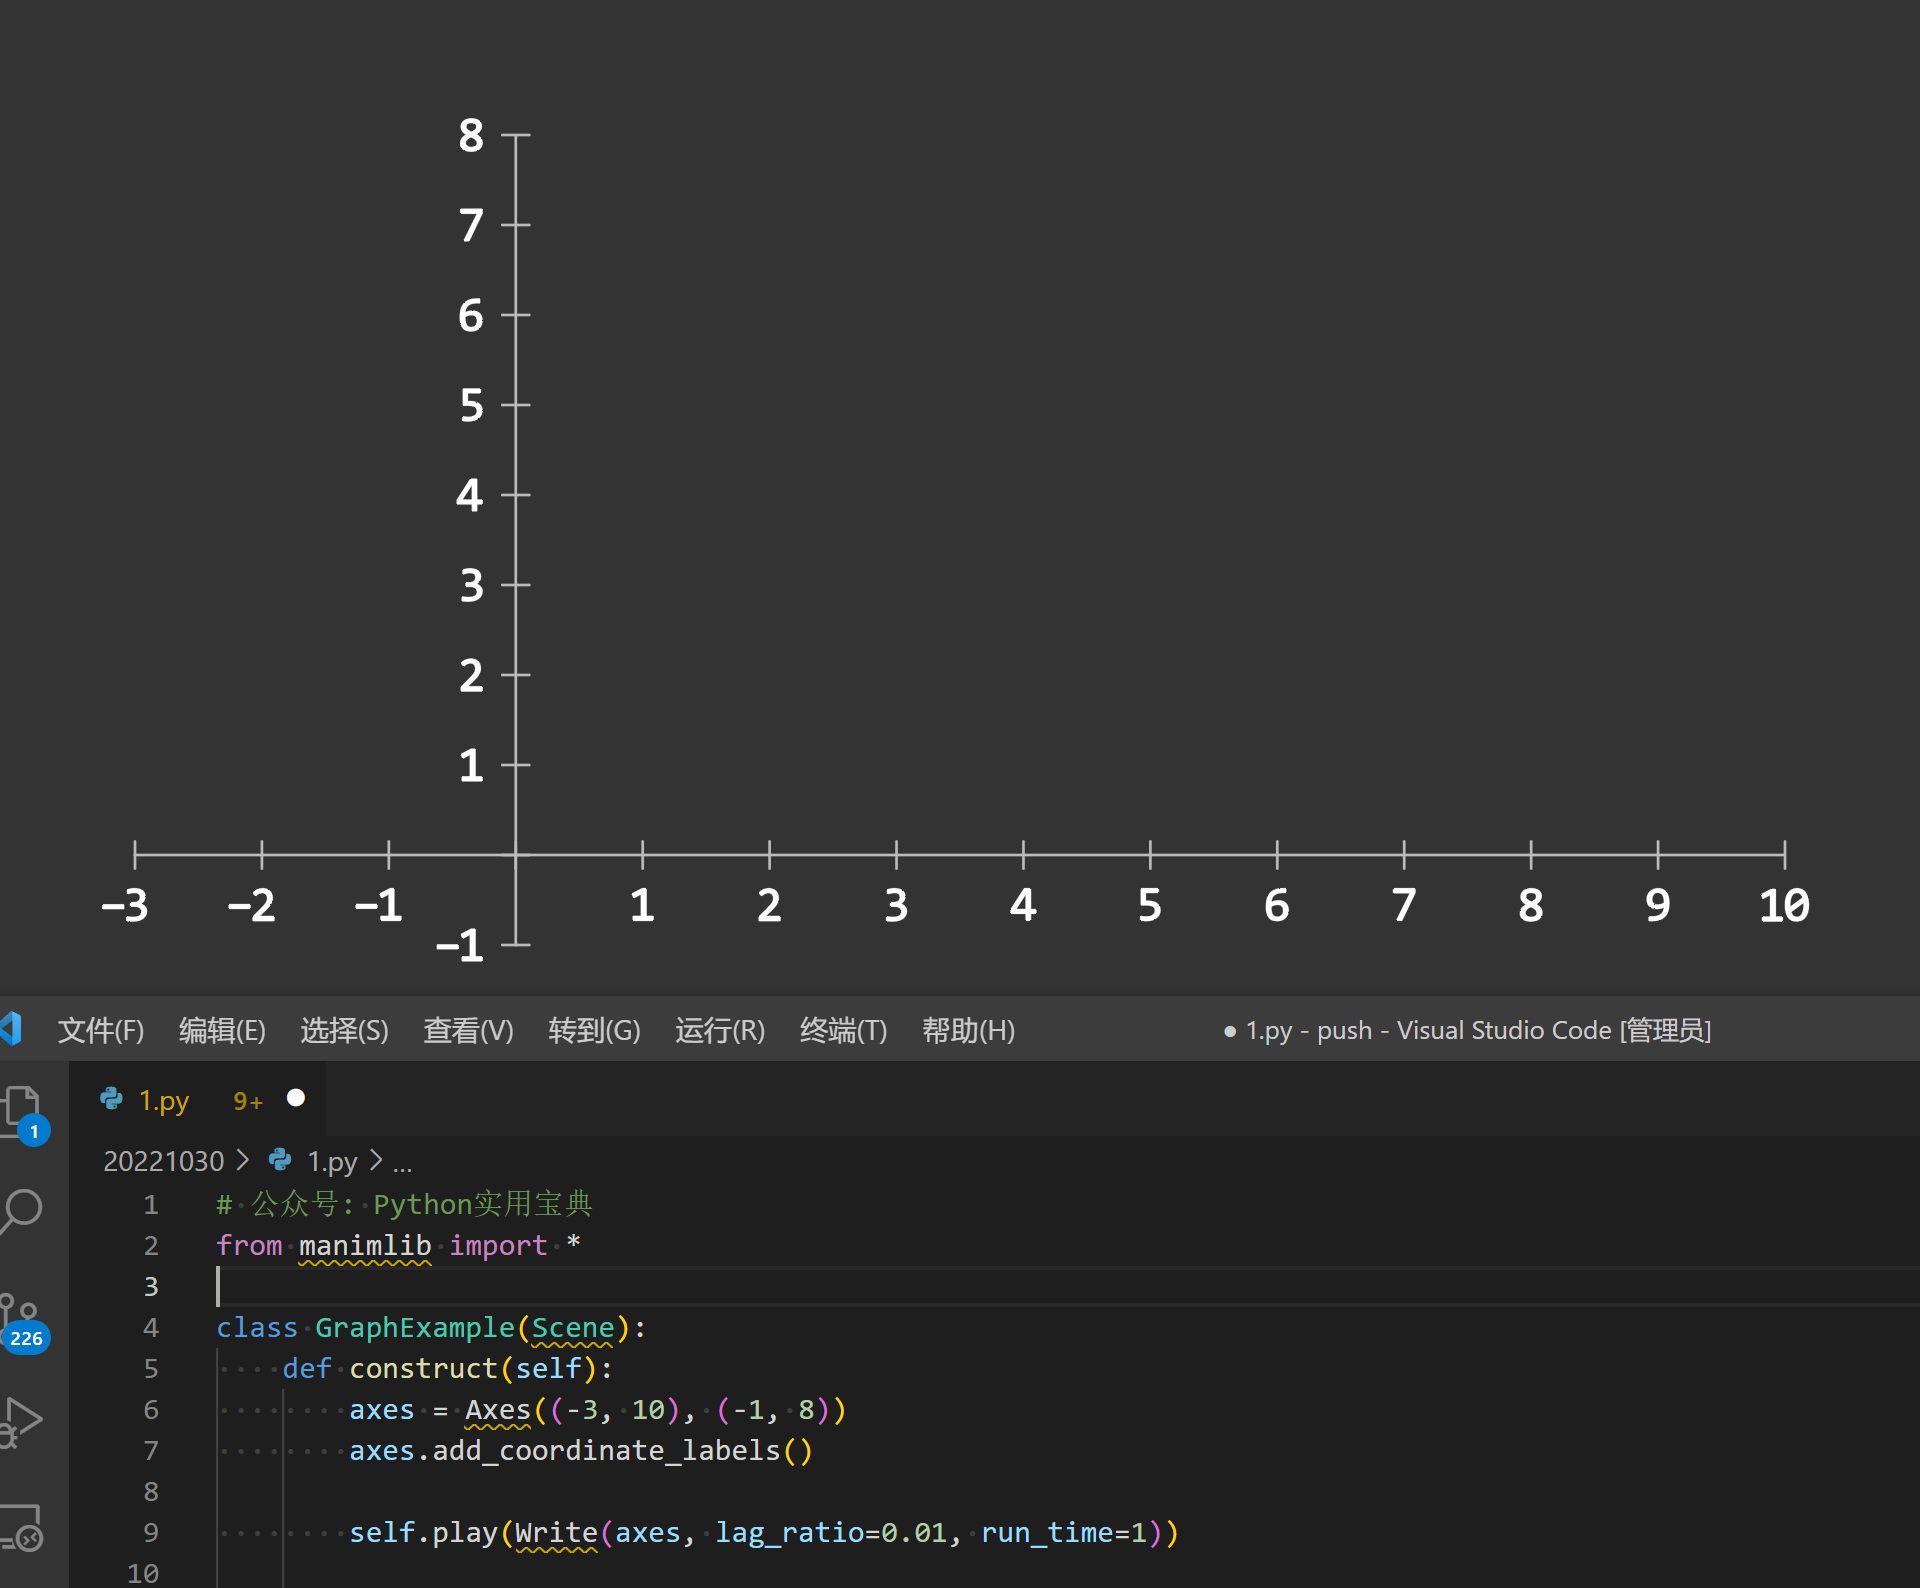
坐标轴绘制完成后,就可以开始绘制图像了:
class GraphExample(Scene):
    def construct(self):
        axes = Axes((-3, 10), (-1, 8))
        axes.add_coordinate_labels()

        self.play(Write(axes, lag_ratio=0.01, run_time=1))

        # Axes.get_graph会返回传入方程的图像
        sin_graph = axes.get_graph(
            lambda x: 2 * math.sin(x),
            color=BLUE,
        )
        # 默认情况下,它在所有采样点(x, f(x))之间稍微平滑地插值
        # 但是,如果图形有棱角,可以将use_smoothing设为False
        relu_graph = axes.get_graph(
            lambda x: max(x, 0),
            use_smoothing=False,
            color=YELLOW,
        )
        # 对于不连续的函数,你可以指定间断点来让它不试图填补不连续的位置
        step_graph = axes.get_graph(
            lambda x: 2.0 if x > 3 else 1.0,
            discontinuities=[3],
            color=GREEN,
        )

        # Axes.get_graph_label可以接受字符串或者mobject。如果传入的是字符串
        # 那么将将其当作LaTeX表达式传入Tex中
        # 默认下,label将生成在图像的右侧,并且匹配图像的颜色
        sin_label = axes.get_graph_label(sin_graph, "\\sin(x)")
        relu_label = axes.get_graph_label(relu_graph, Text("ReLU"))
        step_label = axes.get_graph_label(step_graph, Text("Step"), x=4)

        self.play(
            ShowCreation(sin_graph),
            FadeIn(sin_label, RIGHT),
        )
        self.wait(2)
        self.play(
            ReplacementTransform(sin_graph, relu_graph),
            FadeTransform(sin_label, relu_label),
        )
        self.wait()
        self.play(
            ReplacementTransform(relu_graph, step_graph),
            FadeTransform(relu_label, step_label),
        )
        self.wait()

        parabola = axes.get_graph(lambda x: 0.25 * x**2)
        parabola.set_stroke(BLUE)
        self.play(
            FadeOut(step_graph),
            FadeOut(step_label),
            ShowCreation(parabola)
        )
        self.wait()

        # 你可以使用Axes.input_to_graph_point(缩写Axes.i2gp)来找到图像上的一个点
        dot = Dot(color=RED)
        dot.move_to(axes.i2gp(2, parabola))
        self.play(FadeIn(dot, scale=0.5))

        # ValueTracker存储一个数值,可以帮助我们制作可变参数的动画
        # 通常使用updater或者f_always让其它mobject根据其中的数值来更新
        x_tracker = ValueTracker(2)
        f_always(
            dot.move_to,
            lambda: axes.i2gp(x_tracker.get_value(), parabola)
        )

        self.play(x_tracker.animate.set_value(4), run_time=3)
        self.play(x_tracker.animate.set_value(-2), run_time=3)
        self.wait()
在这份代码中,我们先绘制了Sinx的图像,通过 ReplacementTransform 和 FadeTransform 转换成 ReLu 函数,然后通过同样的步骤转换成了Step图像。最后实现点在曲线上的移动。
manimgl 你的py文件名.py GraphExample
效果如下:

如果在运行的时候你出现了这样的错误:
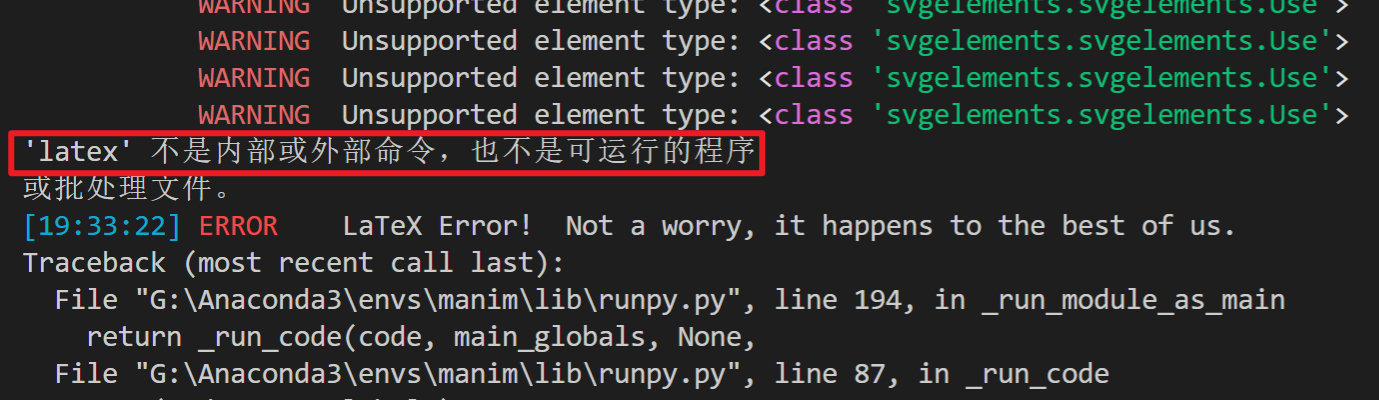
请下载安装MiKTex和dvisvgm.
MiKTex: https://miktex.org/download
Dvisvgm: https://dvisvgm.de/Downloads/
还有更多有趣的绘制案例,你可以在Manim官网上学习:
https://docs.manim.org.cn/getting_started/example_scenes.html
我们的文章到此就结束啦,如果你喜欢今天的 Python 教程,请持续关注Python实用宝典。
有任何问题,可以在公众号后台回复:加群,回答相应验证信息,进入互助群询问。
原创不易,希望你能在下面点个赞和在看支持我继续创作,谢谢!
Python实用宝典 ( pythondict.com )
不只是一个宝典
欢迎关注公众号:Python实用宝典

评论(0)